An ambitious 5-year project to map the birds of New Zealand across every part of New Zealand was launched at Queen’s Birthday weekend. It’s called the New Zealand Bird Atlas and organisers are hoping to involve as many New Zealanders as possible in spotting, counting and recording the birds they see – be it at the top of a mountain, down at the local park or hanging out in their own backyard.

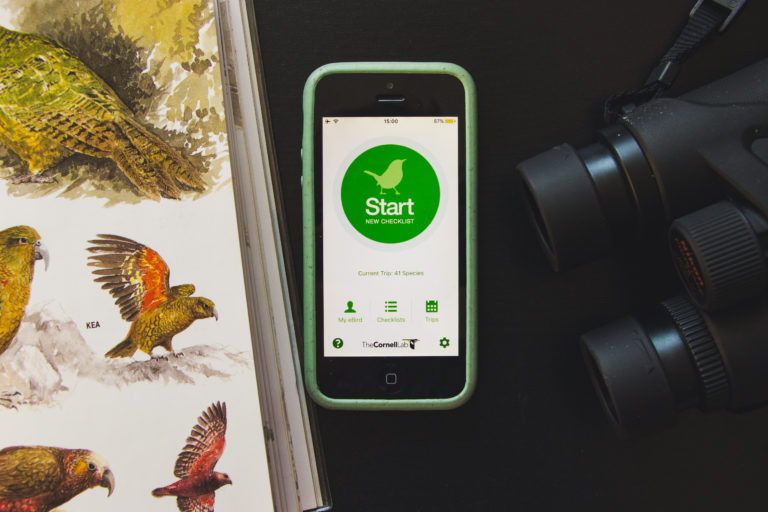
All you need to do to take part is download the specially developed eBird app, maybe grab some binoculars and a bird field guide to help with bird ID and you’re good to go.
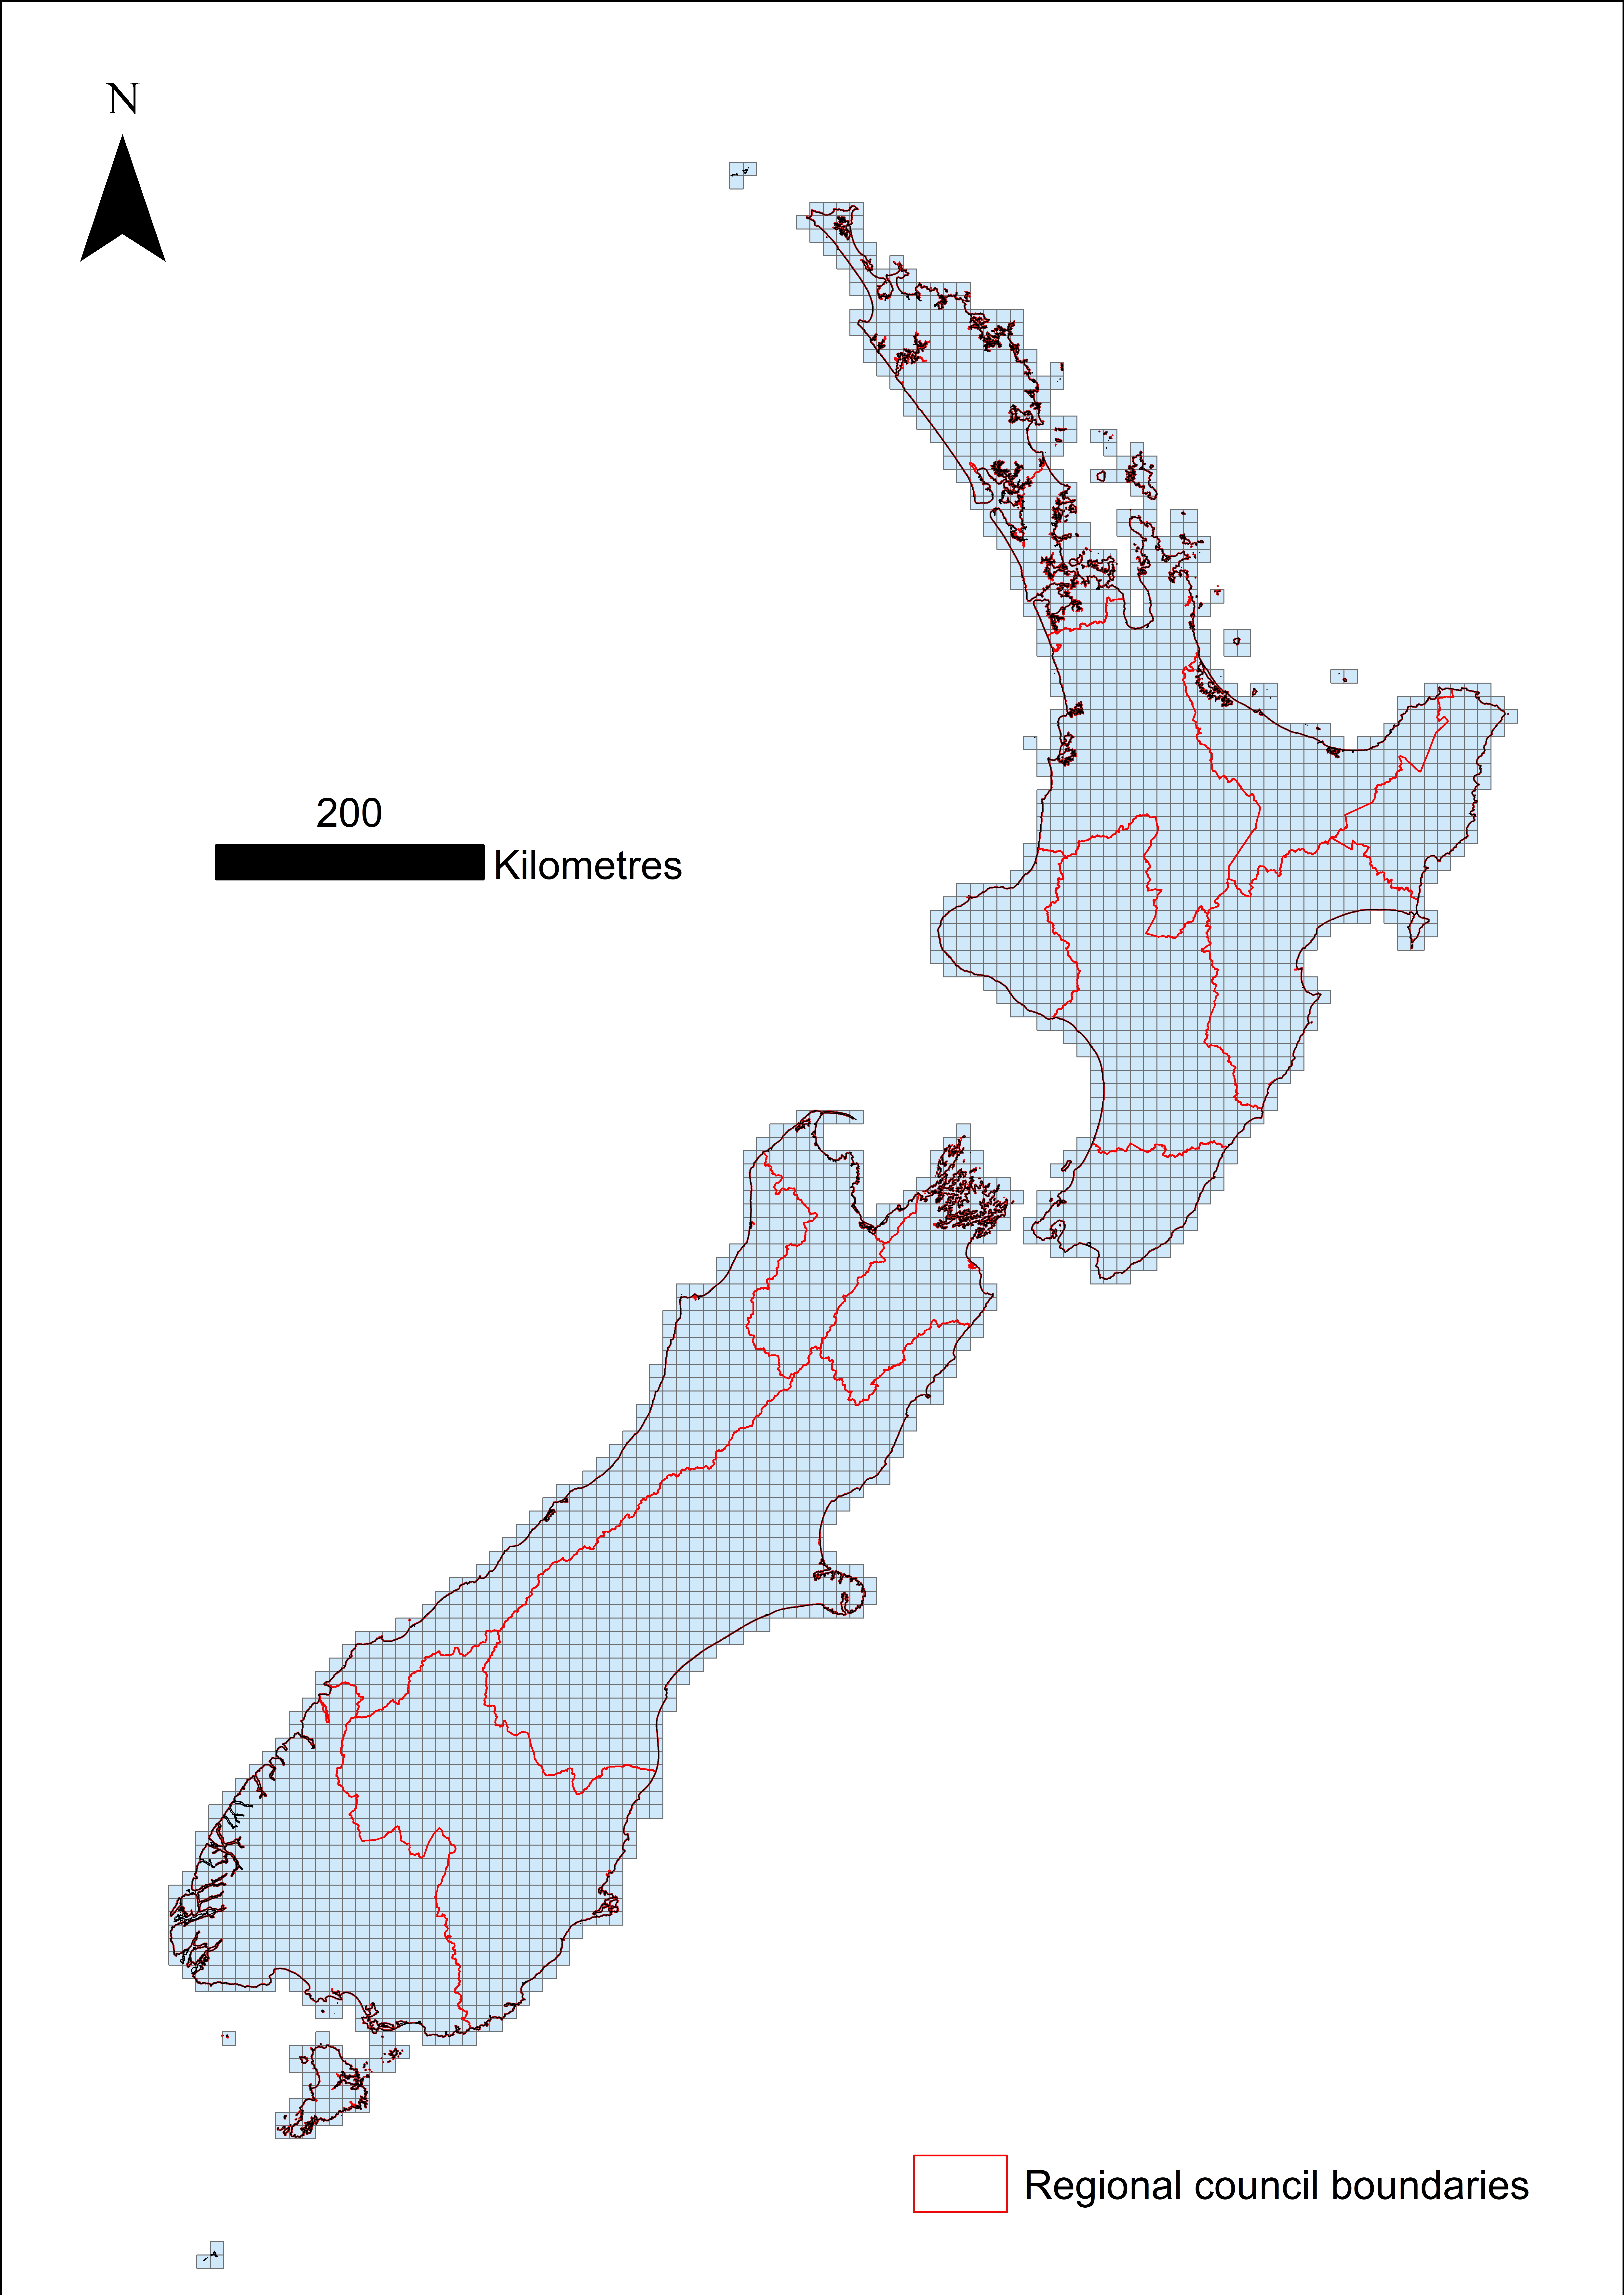
The Bird Atlas aims to build up a picture of both the abundance of our bird species and also where they’re most likely to be found. The whole of New Zealand, including the Chathams and sub-Antarctic islands has been divided into a grid of 10km squares and it’s hoped that between now and 31 May 2024, data for all of those grid squares will be filled in. What’s more, utilising the benefits of technology, progress will be able to be followed in real time on the dedicated Bird Atlas section of the eBird Database as the data flows in through the mobile phone app.
Nikki McArthur, a senior ecologist with Wildlife Management International and keen birder himself, has been involved in planning the Bird Atlas project for Birds New Zealand.
“It’s very exciting to finally push the start button and go out and watch some birds, which we all enjoy,” says Nikki. “It’s been about 4 years of planning, with a very slow gestation for the first 2 years.”

Birds New Zealand members were keen to run a bird monitoring scheme – but the question was how?
“For the first 2 years we produced discussion papers and talked to DOC and Landcare Research and the project slowly coalesced as the purpose formed. Then about a year and a half ago we nailed it down and everything started progressing quickly,” Nikki says.
The Bird Atlas will be the first snapshot of the status of all our bird species for twenty years. It will build on the legacy of Bird New Zealand’s two previous bird mapping projects, ‘Bird Distribution of New Zealand’ in the 1970s and early 2000s, but unlike the data-collectors in those two surveys, participants this time won’t be ‘flying blind’.
“For those earlier surveys, 3 or 4 times per year a map with a coloured grid would be produced, showing where data had been collected, but the rest of the time, people had no idea of where the gaps in survey coverage were, so efficiency was much lower,” Nikki explains. “This time, data collected will display in real time on the Bird Atlas section of the eBird Database. It will be a powerful tool to show how we’re going and let participants see in real time where the gaps are. Anyone can see the grid squares where no-one’s been.”
The eBird Database has been going for about 10 years and will be familiar to dedicated birders who enter data on bird sightings. Up until now it’s been seen as a ‘birders thing’, rather than a biodiversity database, but Nikki and the Bird Atlas team hope that it will soon become familiar to a whole lot more New Zealanders.

“Once you get your head around how it works, it becomes very quick and easy to use – very second nature,” says Nikki. “The message we want to get across to people is that doing the Atlas Survey doesn’t need to be the core activity. You can be checking traps, walking the dog. If you’ve got your phone with you, it can be a background activity – a habit-forming thing.”
The ability of cell phones to record GPS location, date and time automatically makes data collection a whole lot easier than when previous survey participants needed to record their map coordinates manually.
“For people who are familiar with using apps on their smart phone, it will be very easy,” says Nikki. “The app designers have tried to make it as intuitive as possible. But for those who are not so comfortable with technology who want to take part, there are non-digital pathways to submit data as well – for example, printing a data sheet off our website, filling it in and posting it back to us.”
The issue with the ‘old fashioned’ methods is the manual data entry that then needs to be done and the higher chance that errors or inaccuracies will be introduced along the way.
“With the 2nd Bird Distribution Survey, over the 5-year period there were hundreds of thousands of data sheets submitted with a team of people entering data for months, which in turn, slowed down the publication of the results at the end of the project,” explains Nikki. “So using the app is preferred. With data entered on the go, it will lead to faster publication of the Atlas. We’re also hoping to roll out training resources on using the eBird app.”
With recent advances in computer modelling, the current New Zealand Bird Atlas will utilise and develop occupancy maps for individual species. These “heat maps” will produce a more realistic visualisation of the current distribution and abundance of each species. Previously this new modelling and mapping technology wasn’t available and will be a significant advance in this Atlas.
“The Bird Atlas and eBird app is a Citizen Science project – the success of the project will be determined by how many people use the app,” says Nikki who is keen to encourage as many people as possible to give the app a go.

Unlike previous bird surveys, when one record sheet per square was requested, participants will be asked to submit a complete checklist for each habitat within a 10 x 10km square.
“Participants are free to choose where, and when they go birding, and how long they spend birding. A complete checklist is simply a record of all the birds seen or heard during a specific recorded time period – so the length of observation can be determined by the observer – there is no set time. The only request is that when one moves from one habitat type to another, a new checklist is started. For example when you leave farmland and enter a patch of native forest, you finish one checklist, and start a new one inside the forest; or you leave a residential area and walk along the beach you start a new checklist once on the beach.”
Once the results are in, there will be 3 spatial scales in which it can be use – at a national, regional and local level.
“The Parliamentary Commissioner for the Environment recently carried out a new analysis of the previous Atlas data sets to show that there had been a substantial decline in birds across New Zealand from the 1970s to the early 2000s,” says Nikki. “It was something people in the field knew, but the PCE was able to show the details in maps and numbers. It was what drove the recommendations in the PCE Report for landscape-scale predator control.”
It’s hoped that the third Bird Atlas will give an even clearer, more detailed picture of what is currently happening with birds across Aotearoa/New Zealand.
“On a national level, for the DOC-managed conservation estate, DOC will be able to use the data to prioritise resources to maximise conservation outcomes,” says Nikki. “On a regional scale, regional councils will be better able to report on the state of the environment in their region.
The data collected will have local level applications as well.
“Specific habitats and locations within each 10km grid square will be recorded across New Zealand that can be used at a site scale,” says Nikki. “It’s an information resource that just doesn’t exist currently in most regions. The information could be used for assessing the likely impact of developments such as roading projects or new subdivisions. We’ve been talking to Regional Councils, DOC and Landcare all the way through as we’ve been designing the scheme to make sure we meet those needs.”
One of the key principles of this 3rd Bird Atlas project is the guarantee that the data collected will be made available free of charge for all non-profit, conservation applications. That’s a significant change from the first two bird distribution projects where Birds New Zealand adopted a ‘User Pays’ stance for the data that had been collected at the Society’s effort and expense.
Making the information freely available, has, however created a new challenge for the society.
“The challenge has been how to fund the Bird Atlas up front,” says Nikki, “And there have been 3 funding streams. Grants have included a large grant from the Lotteries ‘Environment and Heritage Fund’ which covers most of the infrastructure costs for the first 3 years of the Atlas project. One key sponsor – Goodness Kitchen has also come onboard with funding which proved crucial for getting this project off the ground.”
There are definite financial advantages in making sure the volunteer project is a success.
“It is estimated that it will cost $0.5 million to run the Atlas project for 5 years in a way that will maximise results,” Nikki explains. “For government agencies to do the work without volunteers would cost an estimated $7 million!”
To their credit, a number of central and local government organisations have got behind the project.
“Every agency has been very supportive,” Nikki confirms. “The data is crucial for future planning and organisations are excited that the data will be available free of charge. ‘In kind’ support has already been forthcoming and that’s really valuable to us. That includes things like assistance with contacting landowners on behalf of survey participants who need to access private land and promoting the survey over their own social media and to conservation groups in their own regions.”
What happens next depends on all New Zealanders. Nikki, for one, can’t wait to get started.
“I’m itching to get out and collect actual data after 4 years of planning,” he says.

