
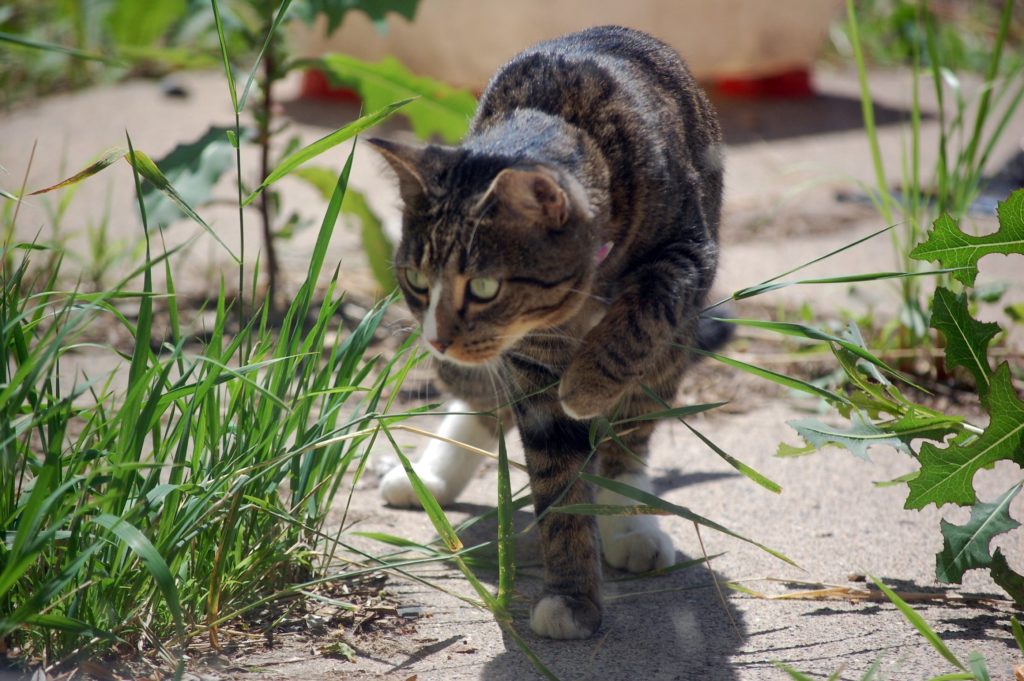
Cats and dogs are both predators of rats – but to what extent is the presence of cats and/or dogs a deterrent to rodents? How do you even measure how ‘nervous’ a rat feels?
Scientists in far-off Swaziland used some interesting techniques to determine how uneasy rats felt in the presence of their natural predators. Although the research was carried out in four remote subsistence farming communities on the other side of the world – the rats (Rattus rattus) that were the most common species in the study, are the same species of black/ship rats found in our own forests and farmland.
The research was undertaken by Themb’alilahlwa A. M. Mahlaba et al as part of the StopRats (Sustainable Technologies) Project and is published online in the Open Access journal PLoS ONE.
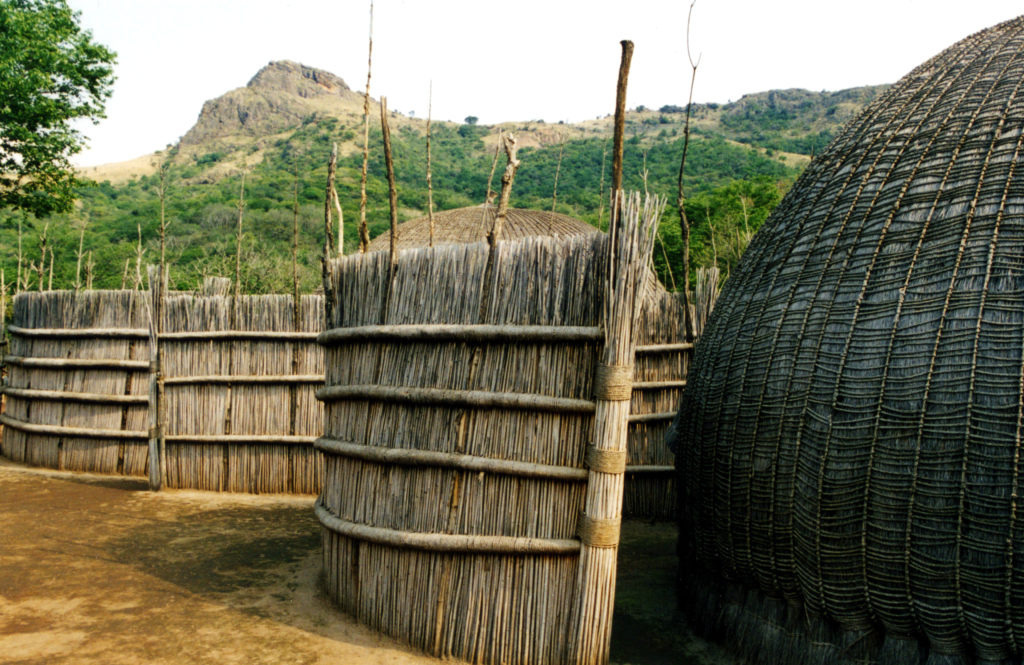
“This study was conducted in four villages: Mahlanya, Sitjeni, Mcaphozini and Elangeni at Lobamba, central Swaziland (690m above sea level). The area has been transformed into a matrix of small-scale subsistence farmland and farmers’ homesteads with none of the original natural vegetation remaining . The staple crop is maize, with sorghum, vegetables and pulses grown on a smaller scale. A typical homestead in this region supports 6-10 people. Each homestead is made of a number of buildings clustered around a main house. Buildings range from thatched stick and mud to corrugated iron and tiled houses. The majority of homesteads engage in small-scale subsistence farming.”
Ten homesteads each with cats only, dogs only, both cats and dogs and no cats or dogs were used in the study – 40 homesteads in total. The foraging behaviour of rats on these homesteads was evaluated by measuring giving up densities (GUD), the points at which rats gave up foraging because the risk that the rats perceived outweighed potential foraging gains.
“By creating food patches and assessing the amount of food left after foraging, the giving-up density (GUD) of a food source becomes a measurable unit. The GUD resembles the perceived costs of foraging on that location. The more food left in a patch after the departure of an animal, the higher the GUD, indicating high costs. With respect to foraging costs, every so often prey need to sacrifice food for safety, and this has been termed the ‘landscape of fear’.”
‘Tracking tiles’ were used initially to measure rat activity at the homesteads. They work on the same principle as ‘tracking tunnels’ commonly used in New Zealand.
“We quantified rodent activity at each homestead with the use of ‘tracking tiles’; white ceramic wall tiles (20cm x 20cm) that were blackened with soot using a smoking paraffin lamp. To measure the relative amount of rodent activity we calculated the percentage area of the tile covered by footprints. We placed tracking tiles out for five consecutive nights in the cool dry season (July 2015) and again in the hot dry season (Oct 2015). We conducted live trapping based on the activity measures conducted in July. During both seasons we placed freshly sooted tiles out each evening, and removed the following morning. We determined the percentage area marked by rodent footprints by placing a transparent plastic sheet, divided into 16 squares (5cm x 5cm), on top of the tile. The number of squares with rodent footprints was expressed as a percentage of the total number of squares.”
Feeding patches were created and giving up density (GUD) was calculated by filling plastic lunchboxes with 1kg of sand, in which 50 peanuts were randomly buried. The researchers then measured the number of peanuts left after rats gave up foraging at the location.
“We placed feeding patches alongside the tracking tiles at each of the 40 homesteads for seven consecutive nights to allow rodents to acclimatise to them. On the afternoon prior to the start of the experiment on day 8 we replenished the feeding patches. For five consecutive mornings we collected the feeding patches and counted the number of remaining peanuts and replaced missing ones.”
The researchers expected there to be more peanuts left when either cats or dogs were present at the location than when neither predator was present. What surprised them, however, was the difference it made to have cats AND dogs present.
“Compared with no domestic predators in the homestead, the GUDs of rodents were significantly higher (fewer peanuts were eaten) at homesteads with both cats and dogs. The predicted giving-up densities of rodents at homesteads with neither cats not dogs was 30 peanuts [15-50], whereas it was 8 peanuts [2-32] at homesteads with both cats and dogs. There was no significant difference in GUDs of rodents at homesteads with cats alone or dogs alone, compared with GUDs of rodents from homesteads with neither cats nor dogs.”
Thus it seems that both predators needed to be present to create a ‘landscape of fear’ where rats are sufficiently nervous to be put off their easy food source. A similar result was found when rat activity was measured using the tracking tiles.
“Rodent activity in homesteads was significantly reduced in the presence of both cats and dogs. Rodent activity in homesteads with cats alone and dogs alone was also reduced, but not significantly so. The predicted number of tracking tiles marked by rodents in homesteads with both cats and dogs was 12 [5-26], with neither domestic predator present the predicted number of tracking tiles marked by rodents was 28 [18-43].”
The full research report is freely available online through PLoS ONE.
Domestic cats and dogs create a landscape of fear for pest rodents around rural homesteads (2017)