
Statistics are a whole lot more than just a bunch of numbers. They can tell a story. They can paint a picture – and sometimes that picture just isn’t pretty. Take for instance, some of the statistics revealed in ‘Our Land 2018’, a report jointly prepared by the Ministry for the Environment and Stats NZ.
According to the Ministry of the Environment “Our land 2018 report presents information about the state of our land, the pressures on this state, and what that means for us and the environment.”
It’s important stuff.
The report was released back in April and the Ministry has gone to commendable effort to get the data ‘out there’. They’ve produced videos to make the key information more accessible, along with summary documents and infographics for those unwilling to read the full 134 page, 6.75MB report.
So what does it say? Well here are a few facts and stats to ponder.
71,000 hectares of native land cover was lost between 1996 and 2012.
Loss of wildlife habitat isn’t something that happened a century ago – it’s still happening now. Specifically, in that 16-year period up to 2012, Aotearoa/New Zealand lost a further 31,000 hectares of tussock grassland, 24,000 hectares of indigenous shrubland, and around 16,000 hectares of indigenous forests, through clearance, conversion, and development.
According to the report, “Although these areas represent a small proportion of each land cover type, the ongoing loss continues to threaten indigenous biodiversity. Coastal and lowland ecosystems that were once widespread (including wetlands) continue to decline in extent. Almost two-thirds of New Zealand’s rare and ‘naturally uncommon’ ecosystems are threatened.”
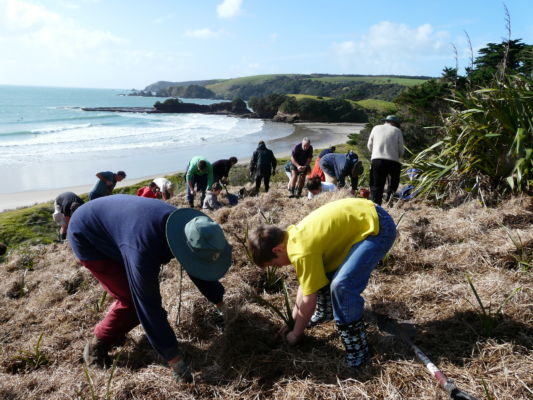
School children, conservation groups, green-fingered and green-minded volunteers across the country are growing native plants and putting a huge effort into fundraising for and replanting natives – but how do you keep on top of a nation-wide loss of 71,000 hectares of native landcover?
Perhaps the next pertinent question is where is all that native land cover going? Don’t put all the blame on farming. According to the report there has been a 7% net loss in the amount of land used for agriculture and horticulture and a 20% decrease in the land used for sheep and beef farming. Dairy has increased by 42% – but some of that increase can undoubtedly be accounted for by sheep, beef and agriculture conversions.
“Agricultural Production Census dropped from approximately 13.4 million hectares in 2002 to about 12.6 million hectares in 2012, a decrease of 7%, mainly in pastoral farming land for sheep and beef. Overall, the main shifts in land cover between 1996 and 2012 were from exotic grassland and shrubland to exotic forest, some conversion in the opposite direction, and a 10% expansion of urban land. Cropland expanded in area between 1996 and 2002 and more so between 2002 and 2008.”
Our towns and cities have grown by 10% – gobbling up some of our most productive and versatile land, according to the report.
“Studies based on changes in land cover indicate that between 1990 and 2008, 29% of new urban areas were on some of our most versatile land. Fragmentation can also be a pressure on urban fringes: in 2013, lifestyle blocks occupied 10% of New Zealand’s most versatile land. This may block future options for agricultural production.”
So what’s not being gobbled up – the bits we can’t easily get to, basically.
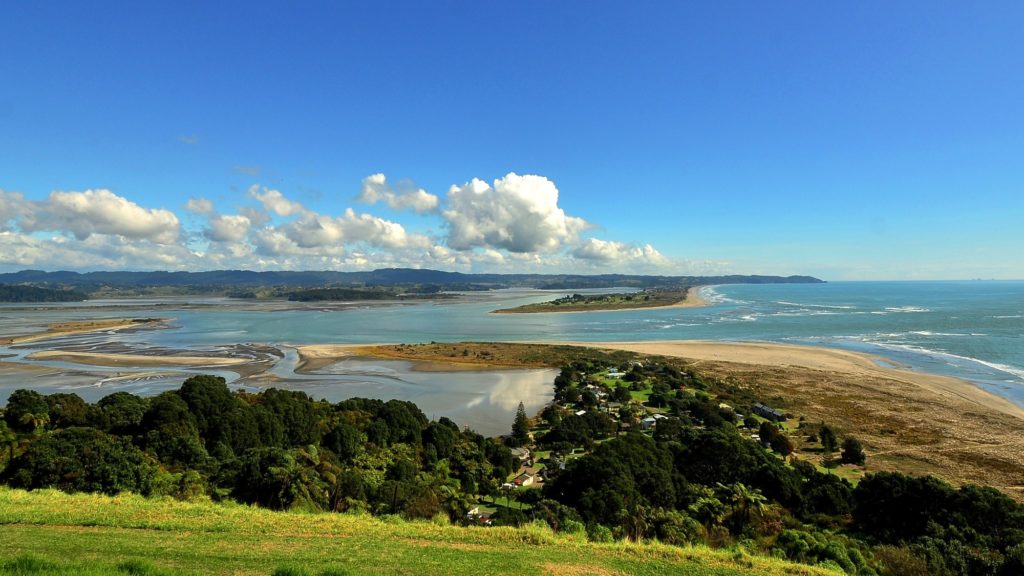
“Change in land cover, historic and recent, is a key pressure on our biodiversity and ecosystems. The remaining indigenous vegetation cover is mostly in hilly and mountainous areas, with only small fragments in lowland and coastal environments. This is not representative of the full range of indigenous ecosystems and habitats.”
Fragmentation of our remaining native land cover has biodiversity implications.
“Pressures from human activity and exotic invasive species can degrade habitat quality, through modification and fragmentation – making indigenous species more vulnerable to the effects of pests, weeds, and diseases. These pressures on land can have a compounding effect, as in many wetland areas. Wetland ecosystems continue to decline in extent, after already declining to about 10 percent of their pre-human extent. This habitat loss can result in habitat degradation through fragmentation. Fragmentation can increase the proportion of vulnerable ‘edge habitats’ and can also result in species isolation, making populations more vulnerable to chance events.”
And what effect is that having on our native species?
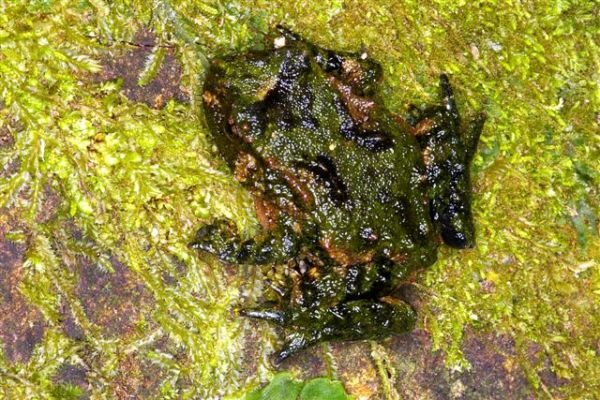
“83% of native birds, bats, reptiles and frogs are classified as either threatened or at risk of extinction. The conservation status of seven bird species, three gecko species, and one species of ground wētā is worsening. The conservation status of 20 bird species is improving – more than half of them are dependent on intensive conservation management.”
The report also has some powerful statistics about introduced predators – where they’re found and how quickly their numbers can potentially grow:
“In 2014, except for some offshore islands and fenced sanctuaries, exotic pests were found over almost all (96.5 percent) land areas of New Zealand. Stoats, possums, and rats were present across 96.5, 94.3, and 94.1 percent of New Zealand, respectively. Red deer and feral goats were present across 57.2 percent and 30.3 percent of New Zealand respectively. Himalayan tahr were present across 7.5 percent of New Zealand (in alpine regions of the South Island). Wilding pines (conifer species, including Douglas fir and lodgepole pine that have spread outside plantations) were present across 6.3 percent of New Zealand.”
The researchers and statisticians also modelled what happens to stoat and rat populations during periodic masting events.
“After a mast-seeding event, rat and stoat populations can increase to up to 5 and up to 9 times their normal peak numbers, respectively. The number of rats is estimated to increase from a normal peak of 190/100ha to 860/100ha after a mast-seeding event. The number of stoats is estimated to increase from a normal peak of 2/100ha to 17/100ha after a mast-seeding event. From their peak, rat numbers take approximately 7 months to decrease to their baseline levels. Stoat numbers decrease much slower than rat numbers, taking approximately 17 months to return to baseline levels.”
If rat numbers have decreased to baseline levels within 7 months, then it’s probably not just rats that the stoats are eating, in those extra 10 months when their own numbers remain high.
The full report (along with summary documents and videos) can be viewed on the Ministry of Environment website.