
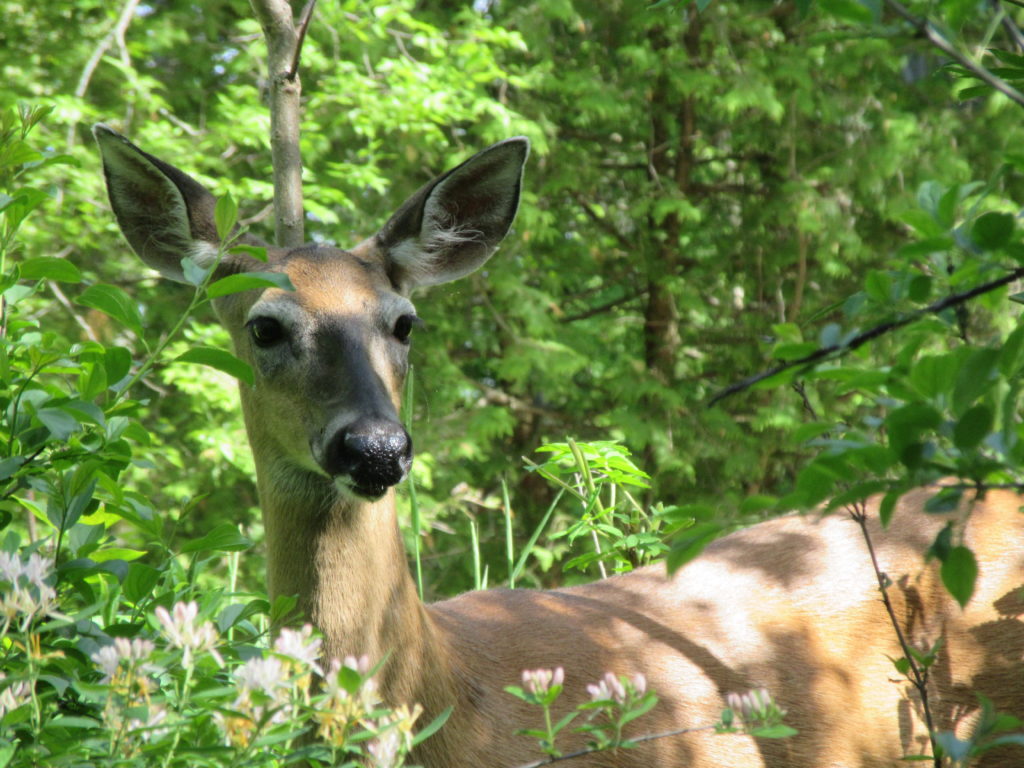
Not all introduced mammals are predators. Apart from omnivorous pigs, the 14 types of ungulate (hooved) mammals introduced here over the years are all plant-grazers of one sort or another.
But restoring habitat and removing predators go hand-in-hand if we’re to reverse the downward spiral of our native wildlife. Large, heavy-hooved browsing mammals can damage habitat, compete for food and eat out the forest understory if their populations are allowed to get too high.
For many people, hunting pigs, deer and other ungulates has a high recreational value
For many people, hunting pigs, deer and other ungulates has a high recreational value – and it puts food on the table. But despite current hunting levels, anecdotal evidence suggests ungulates have been increasing steadily in our wild places, from an historic low in the 1980s. If we are to protect remaining wild habitat and restore other areas, then we need to know how many ungulate mammals there are, if/by how much their numbers are increasing, and where further controls are needed.
So how do you work out the numbers of ungulates across wild New Zealand? Counting them from helicopters is one option – an expensive option as Paul Moloney et al found out. They opted for a ground-based method – counting droppings within randomly selected grids. It’s cheaper – but when you’re not spotting actual animals, its impossible to tell the species apart. One sort of ungulate dropping looks pretty much like another. So taking swabs of droppings for later DNA analysis was part of their field research too.
By the way, what are the 14 types of ungulates which have wild populations in New Zealand? (Pub quiz anyone?)
[Answer: at the end of the article]
“There is concern about the impacts of these ungulates on New Zealand’s ecosystems with large-scale government-funded ground- and helicopter-based hunting implemented in the past to control many populations,” write the authors, “There has also been a long history of these taxa being harvested for recreational and commercial purposes. Consequently, there is substantial interest in understanding the spatial and temporal trends in the abundances of ungulates, and how government control and recreational and commercial harvesting are affecting them.’
About one-third of New Zealand’s land area is managed by the Department of Conservation (public conservation land = PCL), with a mandate to conserve its natural heritage values.
“Introduced ungulates are widespread on PCL, except in Northland where there has been a strategy of eradicating new ungulate populations, and hence ungulate management (including management of recreational and commercial harvesters) is an important function of DOC. To provide a more rigorous approach to reporting on the effectiveness of its biodiversity management, DOC has developed a Biodiversity Assessment Framework (BAF) and Biodiversity Monitoring and Reporting System (BMRS).”
Occupancy and abundance are two indicators of the status and trend of populations.
“Occupancy can be defined as the proportion of sites used by a taxon, and it can be estimated from detection/nondetection data collected at those sites. Abundance is the number of individuals present within an area of interest, but this is difficult to estimate accurately and precisely for wild animals. Hence, indices of relative abundance are more commonly used as the basis for decision-making in the management of animal populations. Occupancy and abundance are inter-related, but many studies report only one quantity: jointly reporting occupancy and abundance provides a fuller assessment of status and trend.”
In their paper, recently published in the New Zealand Journal of Ecology, Paul Moloney et al report on the design and implementation of ungulate monitoring within the Biodiversity Monitoring and Reporting System (BMRS) and report key results from the first measurement cycle, including spatial and temporal trends in ungulate occupancy-abundance on PCL. They also report the effects of government-funded management actions and commercial harvesting on ungulate occupancy abundance.
“The BMRS builds on the network of carbon monitoring plots established in New Zealand during the early 2000s by conducting monitoring at sites located at the vertices of an 8-km grid superimposed over New Zealand’s PCL, including the North Island, South Island, Stewart Island/Rakiura and near-offshore islands. Since the origin of the grid was randomly selected, this is a spatially representative monitoring system.”
The recommended technique involved helicopter-based counts within 4 square kilometre quadrats centred on the vegetation plot, but this method was not further evaluated due to its high estimated cost.
“A cheaper technique, counting intact ungulate pellets along transects of 30 quadrats of 1 metre radius, was therefore used. The sum of the numbers of intact pellets counted along a transect, termed the faecal pellet index (FPI), was the variable of interest. In steep or otherwise dangerous terrain, not all quadrats on a transect can be sampled; for those quadrats, the FPI is calculated by dividing the total number of intact pellets by the number of quadrats sampled and then multiplying by 30.”
Higher faecal pellet abundances is expected to indicate higher ungulate abundances.
“The faecal pellets of the seven deer taxa, feral goat, feral sheep, alpine chamois and Himalayan tahr cannot be reliably distinguished in the field. Hence, FPI is a relative abundance index of all those taxa at a site. To determine the ungulate species present at a site we analysed faecal DNA swabbed from freshly deposited pellet groups.”
Faecal pellets were counted/swabbed at 68 randomly selected sites on the 8 × 8 kilometre grid in forest and shrubland ecosystems (termed ‘woody sites’) in the 2011–2012 field season, and at 80 randomly selected sites in non-woody ecosystems (‘non-woody sites’) in 2012–2013. Further samples were collected annually until 2018.
The monitoring was for all ungulates present on PCL except for feral cattle and feral horse (which have limited distributions and readily distinguishable faeces), and feral pig (which have a wide distribution and readily distinguishable faeces).
“Ungulates are widely considered to be more vulnerable to harvesting and control activities in non-woody habitats than in woody habitats. Also, some ungulate species seem to prefer woody habitat (e.g. rusa deer and sambar deer, both present only in the North Island), but others prefer non-woody habitat (e.g. Himalayan tahr). We therefore included whether a site was dominated by woody or non-woody vegetation as a variable in the occupancy model.”
“During the seven field seasons 2012–2018, a total of 1346 sites were sampled. There were 316 sites sampled on North Island (and near-offshore islands), 1005 sites on South Island (and near-offshore islands in the Marlborough Sounds), and 25 sites on Stewart Island/Rakiura. Due to dangerous terrain or other barriers, the full 120 quadrats (30 on each of 4 transects) could not be sampled at 260 of the 1346 sites.”
“Faecal DNA detected nine of the 11 taxa considered to be present on PCL during 2012–2018. Sambar deer, which have a restricted distribution on PCL in the North Island were not detected. All ‘wapiti’ on PCL are red deer hybrids and could not be distinguished from the latter using our assay.”
Red deer/wapiti were the most common taxa in the North (48 sites) and South islands (91 sites), and white-tailed deer on Stewart Island/Rakiura (6 sites). Feral goat was the second most common taxa detected in the North and South Islands. The only other taxa to be detected at > 10 sites was alpine chamois, which was detected at 12 South Island sites.
“Nationally, ungulate occupancy and abundance were higher at woody than at non-woody sites, and overall were higher in the North Island than in the South Island. Occupancy odds increased by 34% and 21% per annum in the North Island and South Island, respectively. Abundance (conditional on sites being occupied) increased 11% annually in the North Island, but did not change in the South Island.”
According to the researchers, these increases in occupancy and abundance indicate that ungulate populations are recovering from the lows of the 1980s, likely due to reduction in both commercial harvesting and government-funded control.
“The data from the monitoring reported here establish a baseline against which future estimates of ungulate occupancy-abundance, and the effectiveness of management activities, can be assessed. Five-yearly remeasurements at the sites, coupled with more comprehensive recording of information on government control and commercial/recreational harvesting activities, should enable the drivers of future changes in ungulate occupancy and abundance to be better understood.”
The lower ungulate occupancy rates and conditional abundances at non-woody sites reported by the authors probably reflects the greater vulnerability of ungulates on New Zealand’s public conservation land to helicopter-based shooting in these habitats.
“Related to this, commercial harvesting of red deer is currently more economically viable in non-woody habitats. The higher occupancy rates of ungulates at woody sites in the North Island than in the South Island probably reflects several factors: first, the greater diversity of forest-dwelling ungulates in the North Island, e.g. sika deer, sambar deer and rusa deer are present only in the North Island; second, red deer is the most widespread ungulate species in South Island forests, and in the last decade there has been a substantially larger commercial harvest of red deer in the South Island than in the North Island.”
“The higher occupancy rate in South Island non-woody sites is likely to be at least partly a consequence of two alpine ungulates, Himalayan tahr and alpine chamois, being present there. The latter’s distribution includes most of the South Island PCL above the treeline. Himalayan tahr have a more limited distribution but have locally high densities.”
According to the authors, the key harvesters of ungulates in New Zealand are (in descending qualitative order of harvest size) recreational harvesters, commercial harvesters and DOC-funded culling.
“There have not been any robust estimates of recreational hunter harvests since 1988 and DOC-funded culling data have not been systematically collated for all PCL. There are, however, robust records of the numbers of wild ungulates that have been harvested and inspected prior to processing for human consumption, and these data indicate that the numbers of deer harvested declined sharply in the 2000s before increasing again in the 2010s.”
“Whereas all species of deer, plus Himalayan tahr and alpine chamois, were harvested in the 1970s and 1980s, now only red deer and their wapiti hybrids are harvested. The lower commercial harvests, reduced to zero for many species, reflect reduced profitability due to lower real prices per animal harvested and higher operating and compliance costs.”
Commercial harvesting reduced many ungulate populations from their peak densities of the 1960s and early 1970s to lows in the 1980s, but mapping of ungulate species distributions indicates that the geographic ranges of some species have increased since the mid-1990s.
“In particular, there have been substantial increases in the distributions of red deer, fallow deer and Himalayan tahr and a minor increase in the distribution of sambar deer.”
The effects of sustained DOC-funded aerial control on ungulate occupancy and conditional abundance was only evaluated for the South Island.
‘Sustained aerial control did have, on average, negative effects on ungulate occupancy and conditional abundance, but the effect was too variable to be considered significant. Although sustained helicopter-based shooting can reduce ungulate densities, it does not always seem to be the case in forests, where ungulates are more difficult to detect from a helicopter.”
Eradication of new populations of ungulates detected in Northland seems to be working – mostly…
“The near-absence of ungulate pellets detected on PCL north of Auckland is consistent with other knowledge about the low occupancy of ungulates there. This finding suggests that the long-term strategy of eradicating new populations of ungulates that are detected in Northland has been mostly successful. The detection of pellets at three Northland sites is a warning that this strategy needs to be ongoing and sufficiently funded if that area is be kept ungulate-free.”
Of course, not all wild populations of ungulates are found on public conservation land. But monitoring those on private land is difficult – not least because of the presence of domestic sheep, cattle and deer. Even DNA analysis might struggle to distinguish feral deer droppings from the faecal pellets of domestic deer.
“Extending the monitoring programme reported here to all non-public conservation land (which is the majority of New Zealand) would enable unbiased national (i.e. all of New Zealand) reporting of ungulate status and trend. There are different challenges in sampling private land on an 8 km grid, significant ones being obtaining permissions from landholders and the potential presence of domestic ungulates.”
“Five-yearly remeasurements of sites, coupled with more accurate information on government control (including by-kill in aerial 1080 poisoning operations) and commercial and recreational harvesting activities, should enable the drivers of future changes in ungulate occupancy and abundance to be better understood,” the authors conclude.
ANSWER:
The 14 (or 15?) ungulates found in wild populations in New Zealand:
- Western red deer (Found on Public Conservation Land (PCL)in the North Island (NI), South Island (SI), Stewart Island/Rakiura (St/R))
- Wapiti (SI) [NB: have hybridised with western red deer]
- Sika deer (NI)
- Rusa deer (NI)
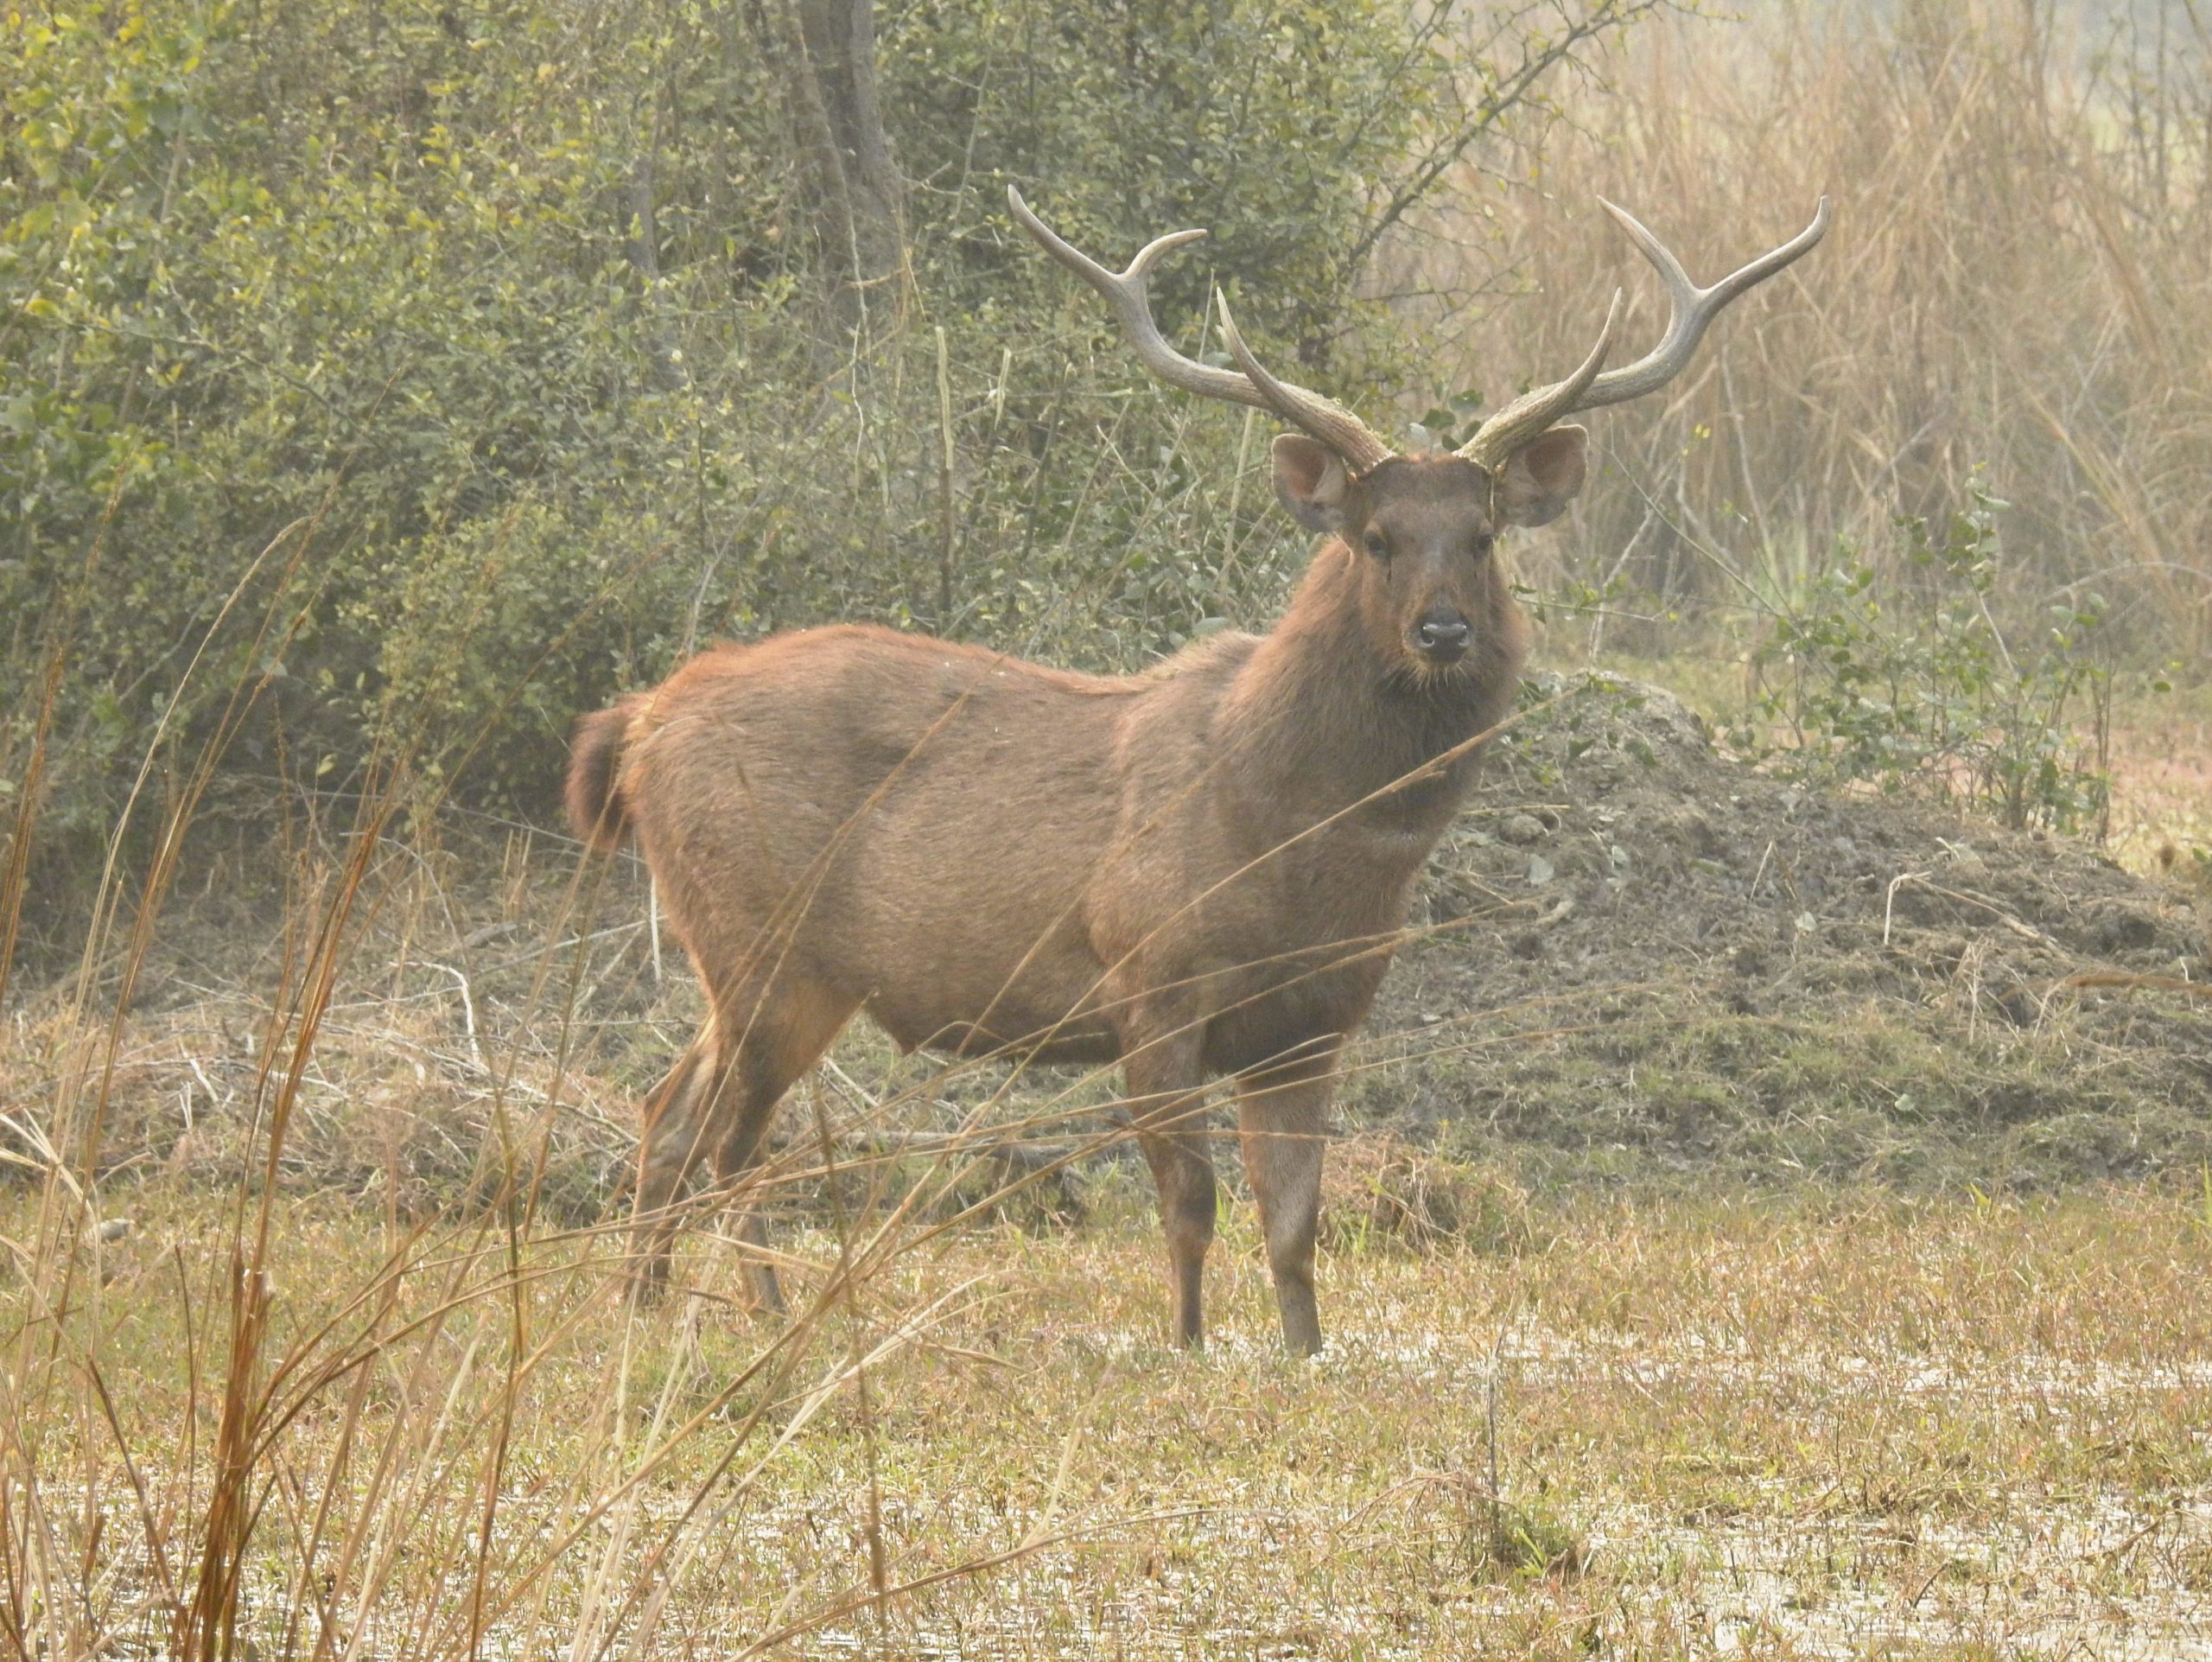
- Sambar deer (NI)
- Common fallow deer (NI, SI)
- White-tailed deer (SI, St/R)
- Feral goat (NI, SI)
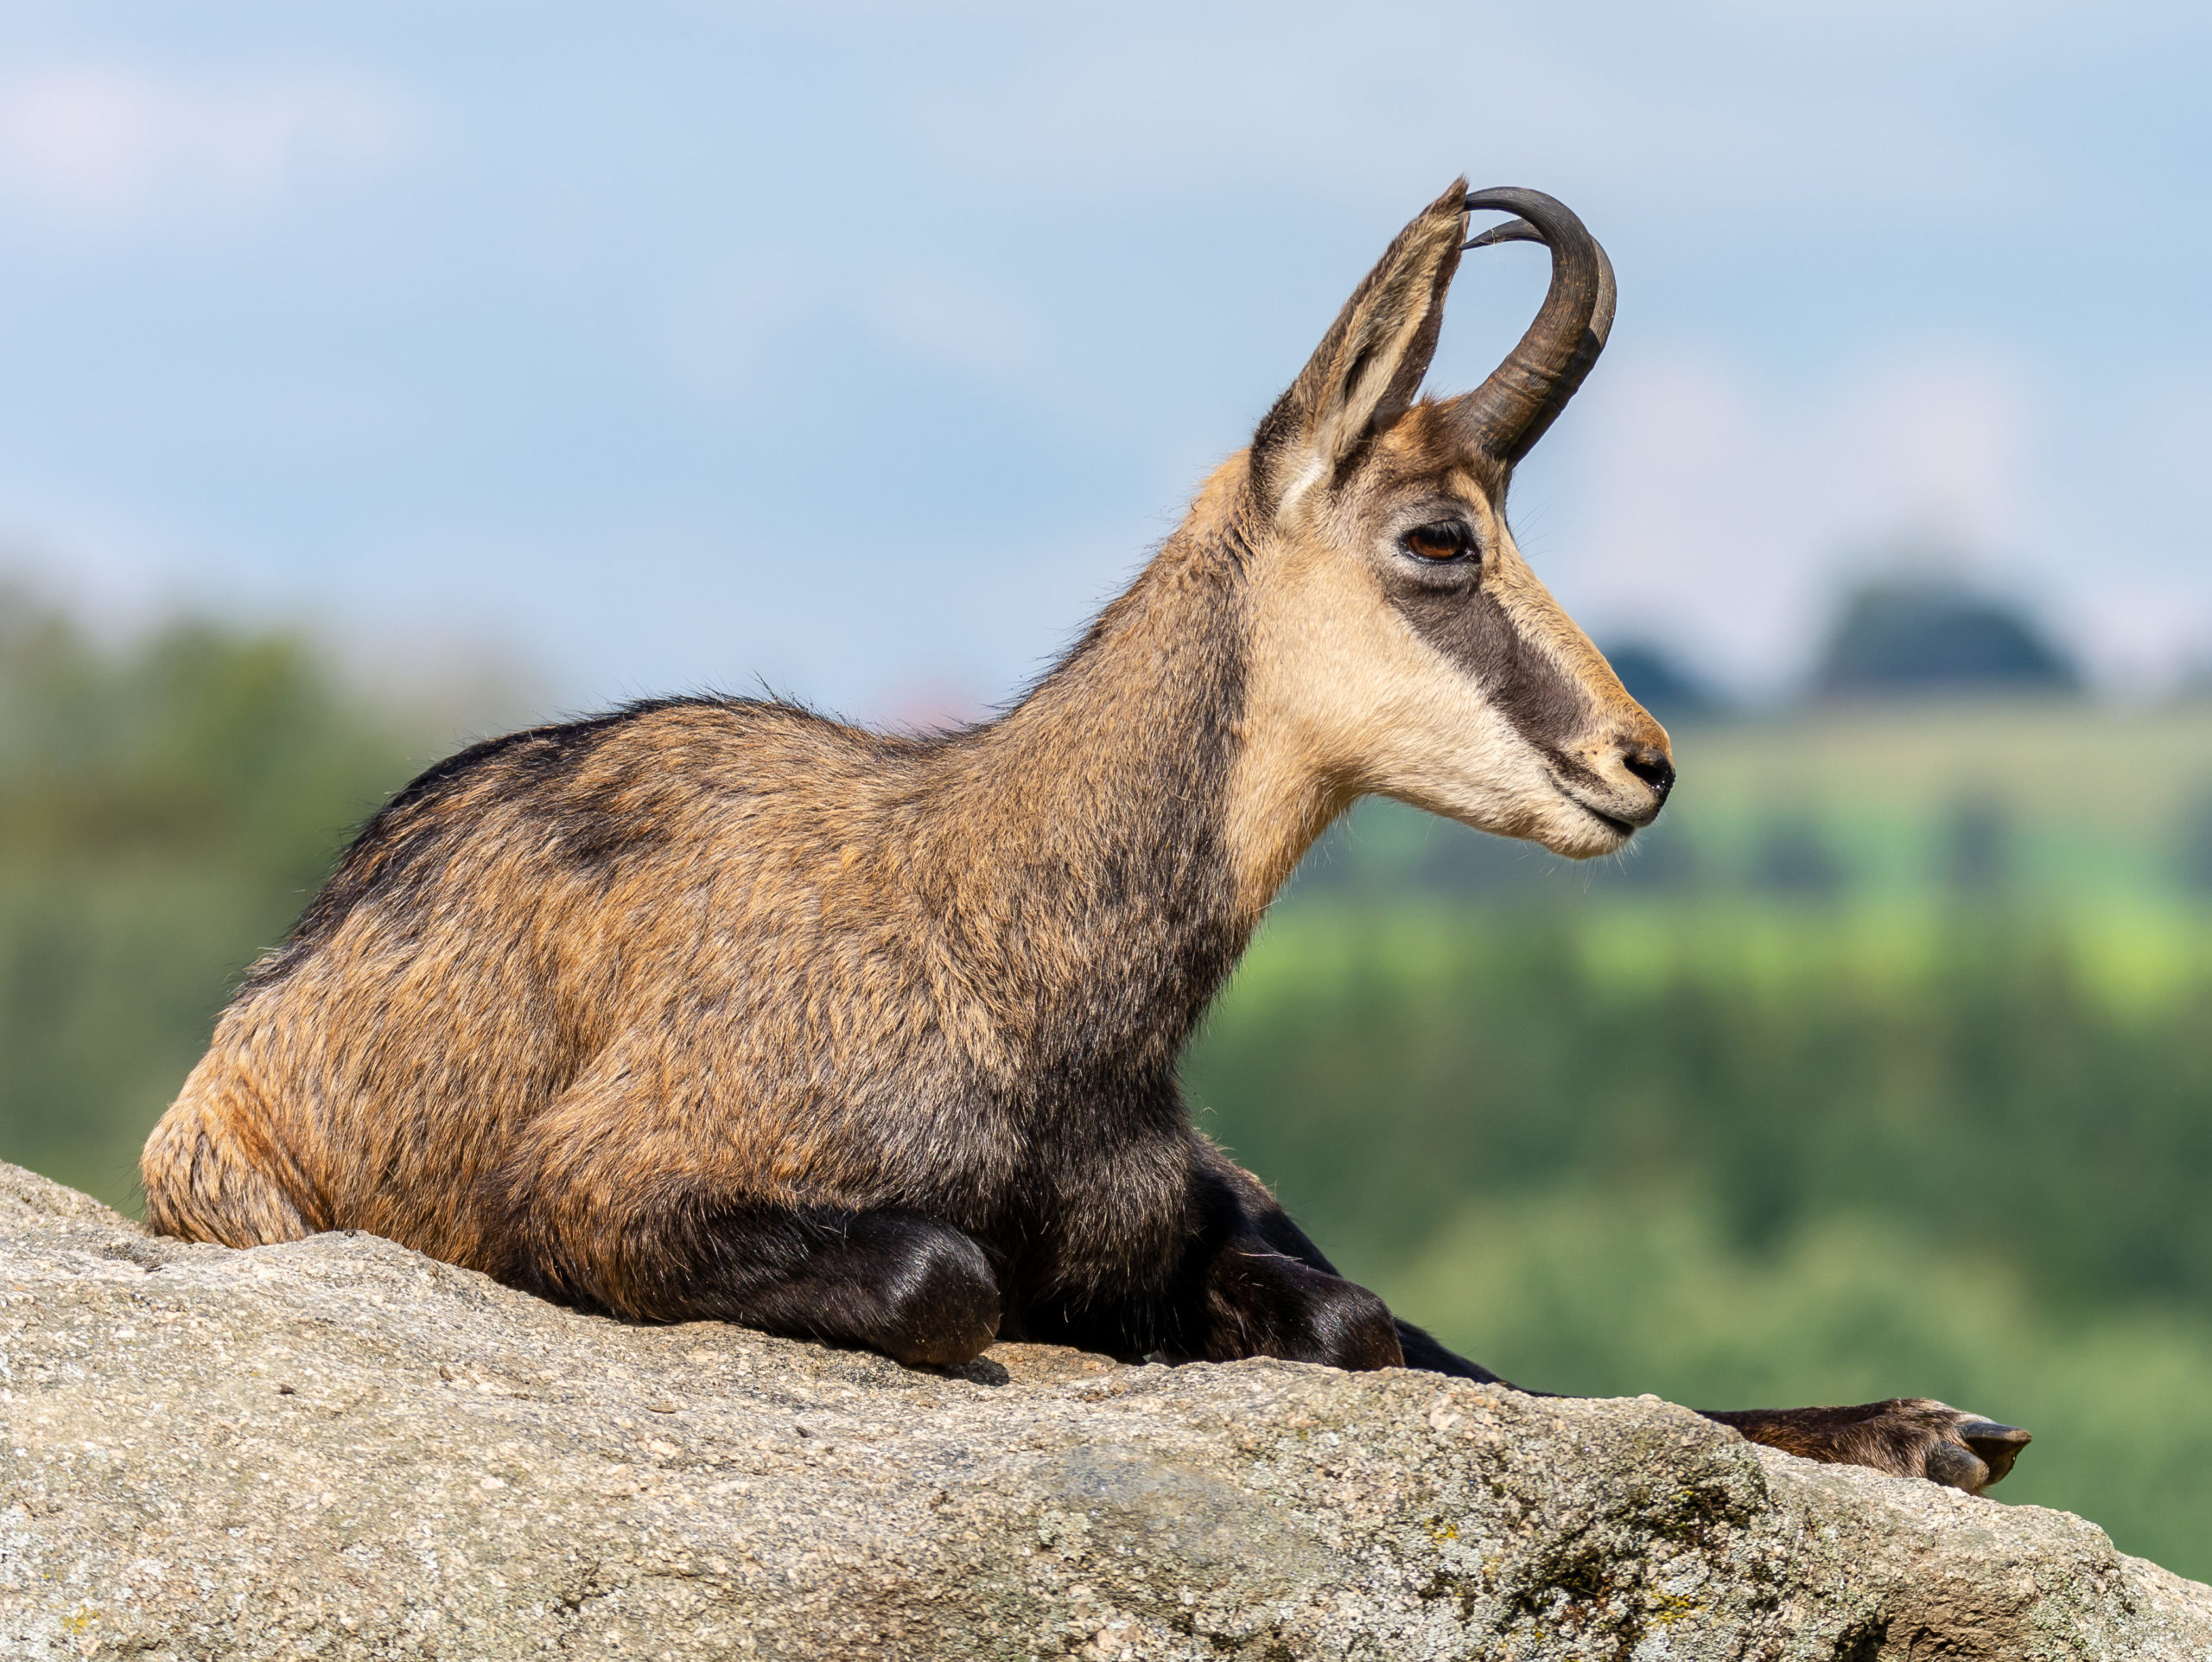
- Alpine chamois (SI)
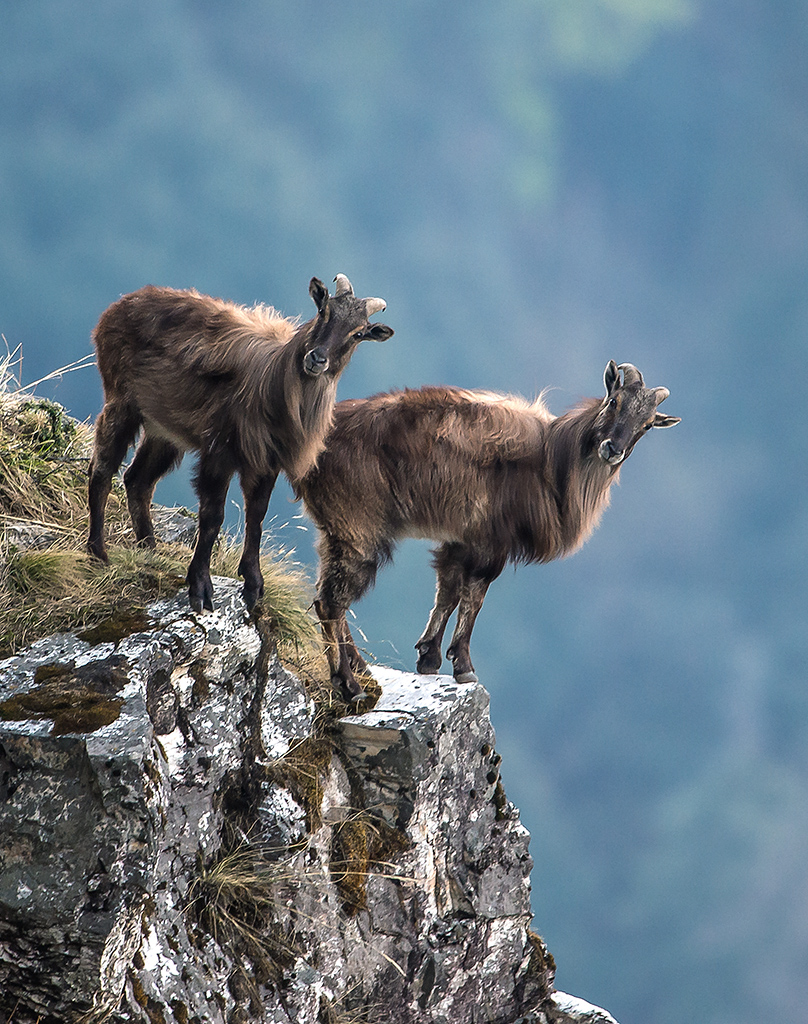
- Himalayan tahr (SI)
- Feral sheep (NI, SI)
- Feral pig (not included in this study)
- Feral horse (not included in this study)
- Feral cattle (not included in this study)
Moose (South Island) are a potential 15th species but are probably extinct or nearly so.
The full research report is published in the New Zealand Journal of Ecology and is freely available online.